Revenue Forecasting Software for Professional Services Firms
Forecast revenue earlier, reduce surprises, protect margins, and improve billing predictability with connected PSA revenue forecasting built for complex professional services firms.
Trusted by 100+ Global Enterprises 20+ Years of Expertise | 50+ Countries
Built for complex multi-project services organizations where margins depend on better planning, staffing, and execution.
Improve Revenue Visibility Before it is Too Late
Professional services firms often struggle to forecast revenue accurately because project demand, staffing, utilization, billing schedules, and delivery changes are disconnected. SAVIOM helps leaders anticipate revenue risks early and improve financial control across the services lifecycle.
Common Challenges
 Unclear future revenue visibility
- Revenue forecasts disconnected from staffing
- Delayed billing inputs
- Poor utilization-to-revenue visibility
- Missed revenue from unbilled work
- Weak margin forecasting
- Manual spreadsheet-based projections
- Limited portfolio-level financial insight
Business Impact
- More predictable revenue
- Better cash flow planning
- Stronger margin protection
- Faster financial decisions
- Improved billing confidence
- Greater leadership visibility

From Demand to Revenue Forecast
Connect revenue forecasting with project demand, resource capacity, utilization, billing readiness, and margin performance.
Sales Pipeline
Project Demand
Resource Capacity
Staffing Plan
Utilization Forecast
Billing Schedule
Revenue Forecast
Financial Reporting
Core Capabilities for Better Revenue Forecasting
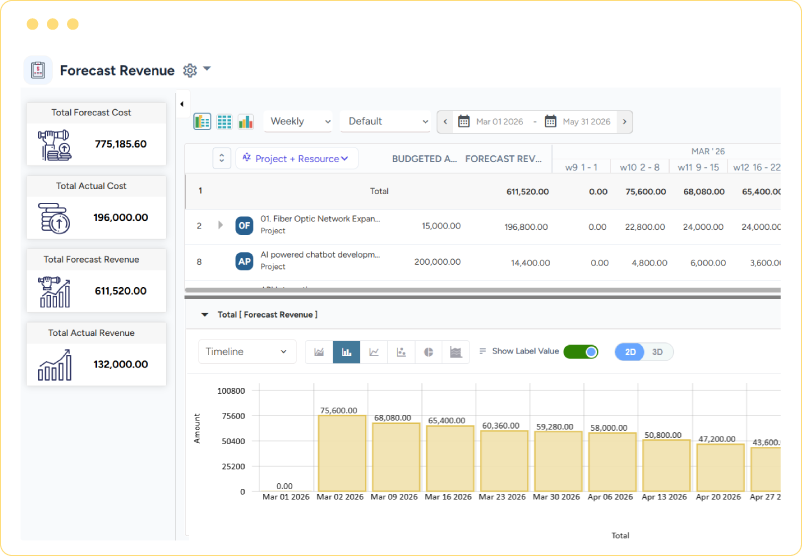
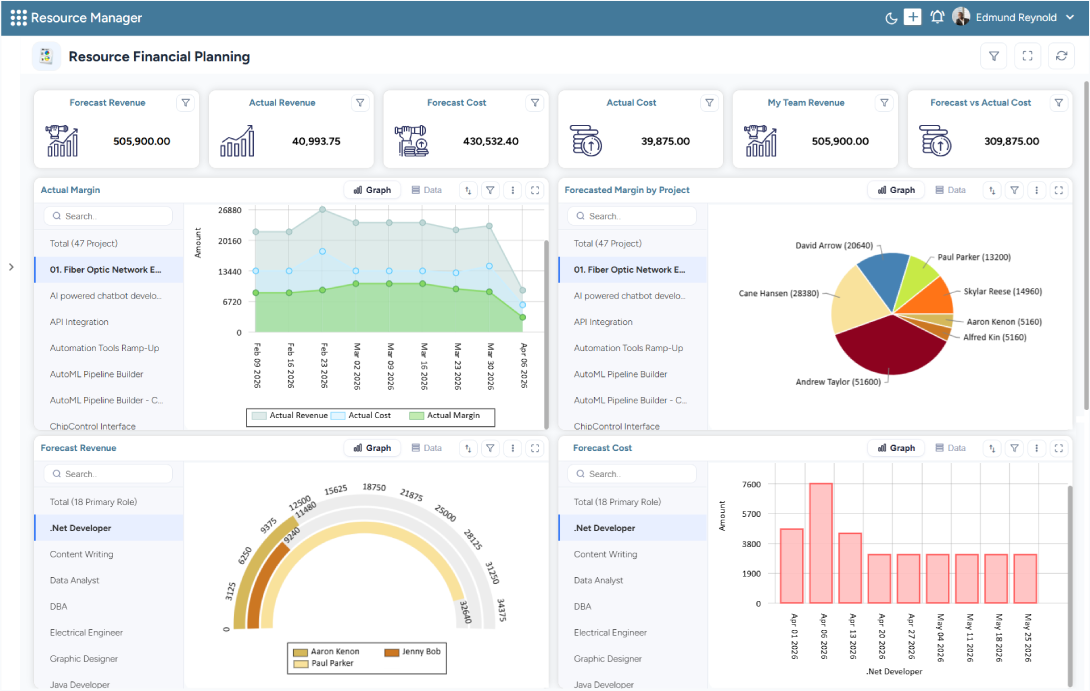
Project Revenue Forecasting
Forecast future revenue across projects, portfolios, clients, and service lines
- Forecast revenue by project or engagement
- Track expected revenue across time periods
- Compare planned vs. projected revenue
- Identify revenue gaps early
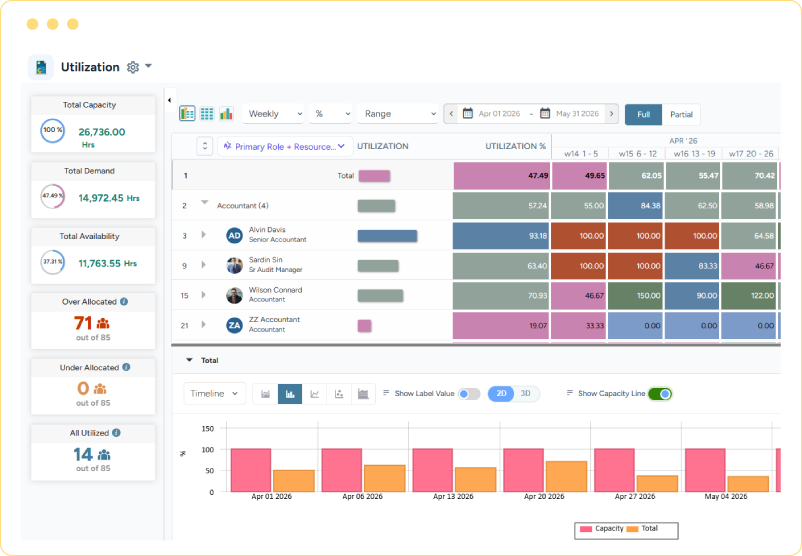
Utilization-Based Revenue Forecasting
Connect billable utilization forecasts with expected revenue outcomes
- Link utilization with revenue projections
- Identify underutilized billable capacity
- Assess impact of bench time on revenue
- Improve deployment-to-revenue visibility
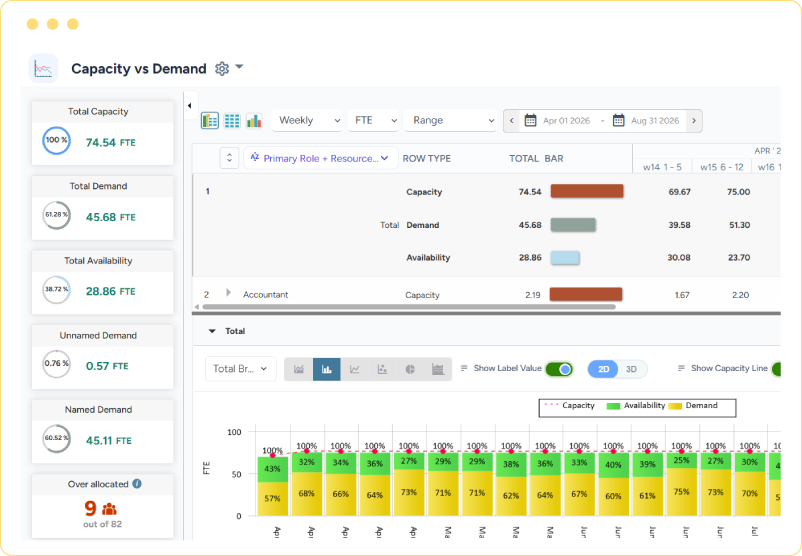
Resource Capacity & Revenue Alignment
Understand how staffing availability affects future revenue delivery
- Compare demand against available capacity
- Identify skill shortages affecting revenue
- Forecast revenue impact of staffing gaps
- Support hiring, outsourcing, or redeployment decisions
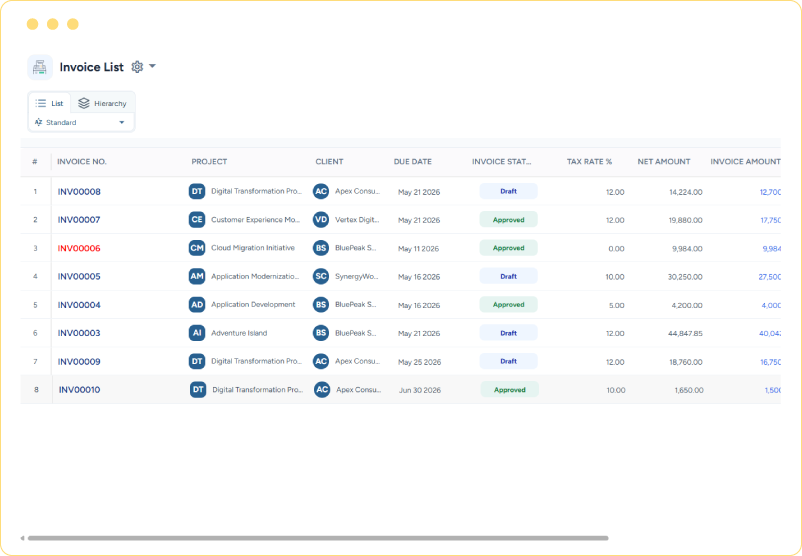
Billing & Cash Flow Forecasting
Improve forward visibility into billing readiness and expected cash flow
- Forecast billable work by period
- Track invoice readiness dependencies
- Identify delayed billing risks
- Support cash flow planning
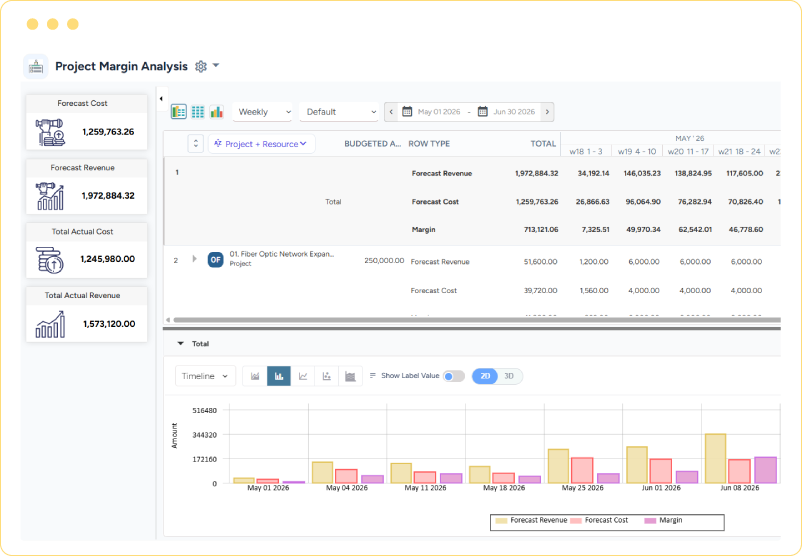
Margin & Profitability Forecasting
Forecast revenue, cost, and margin performance before delivery issues escalate
- Track project-level revenue and cost outlook
- Identify margin risk early
- Compare planned vs. forecast profitability
- Support corrective action before leakage occurs
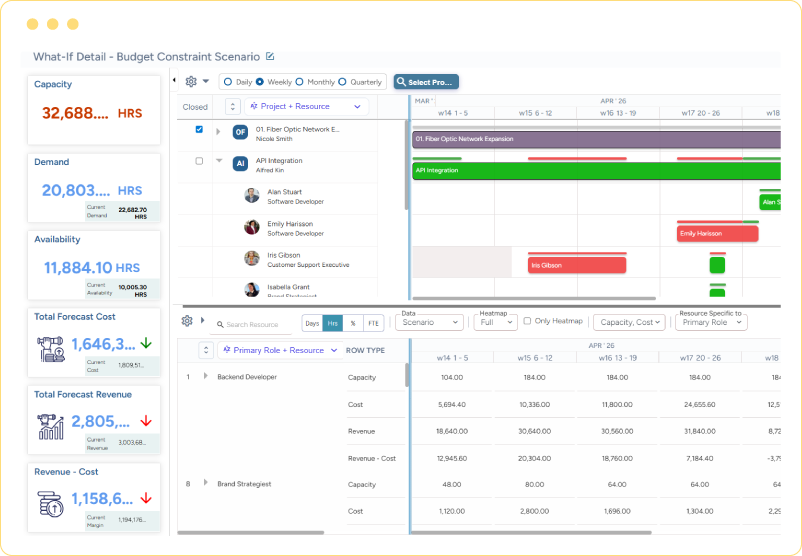
Scenario-Based Revenue Planning
Model how changes in demand, staffing, utilization, or delivery timelines affect revenue
- Simulate staffing changes
- Assess revenue impact of delayed projects
- Model utilization improvement scenarios
- Evaluate portfolio revenue outcomes
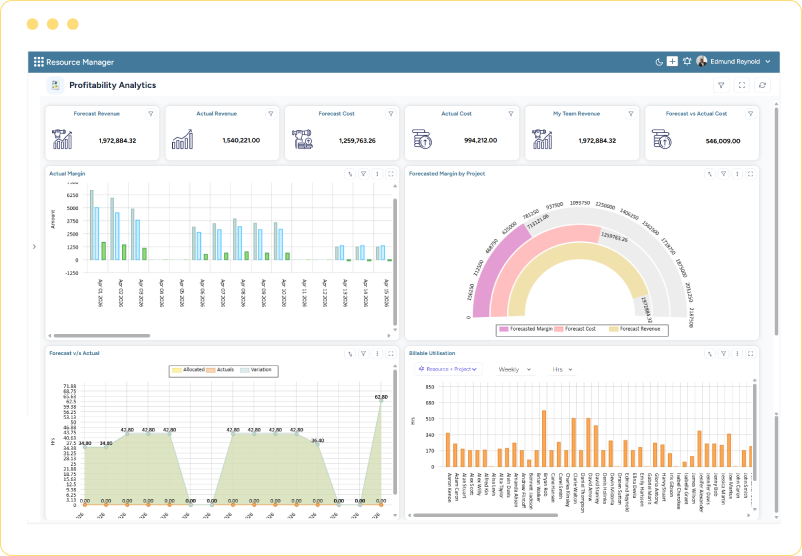
Revenue Reporting & Forecast Intelligence
Give leaders real-time visibility into revenue performance and forecast confidence
- Revenue forecast dashboards
- Portfolio-level financial visibility
- Forecast variance tracking
- Exception-based revenue alerts
Why Services Firms Struggle with Revenue Forecasting
Revenue forecasts often fail when financial planning is separated from project delivery and resource capacity.
Common Gaps Include:
- Sales pipeline not connected to delivery capacity
- Forecasts built manually in spreadsheets
- Staffing gaps discovered too late
- Utilization assumptions not validated
- Billing delays not visible early
- Project margin risks hidden until month-end
- Finance, delivery, and resource teams working separately

SAVIOM helps close these gaps by connecting revenue forecasting with project demand, resource planning, utilization, billing readiness, and financial visibility.
Why SAVIOM Outperforms Basic PSA Revenue Forecasting Tools
Explore End-to-End Professional Services Automation
Professional Services Automation
Streamline service delivery lifecycle
Project Profitability
Improve margins across client projects
Project Management
Deliver every project efficiently
Billing & Invoicing
Ensure timely & accurate invoicing
Billable Utilization and Bench Control
Manage bench to improve billability
Time, Expense & Workflow Automation
Capture time, effort & expense accurately
Why Leading Services Firms Choose SAVIOM
Most PSA platforms show revenue after work is planned or delivered. SAVIOM helps firms forecast revenue earlier by connecting demand, capacity, staffing, utilization, billing readiness, and financial performance in one enterprise planning environment.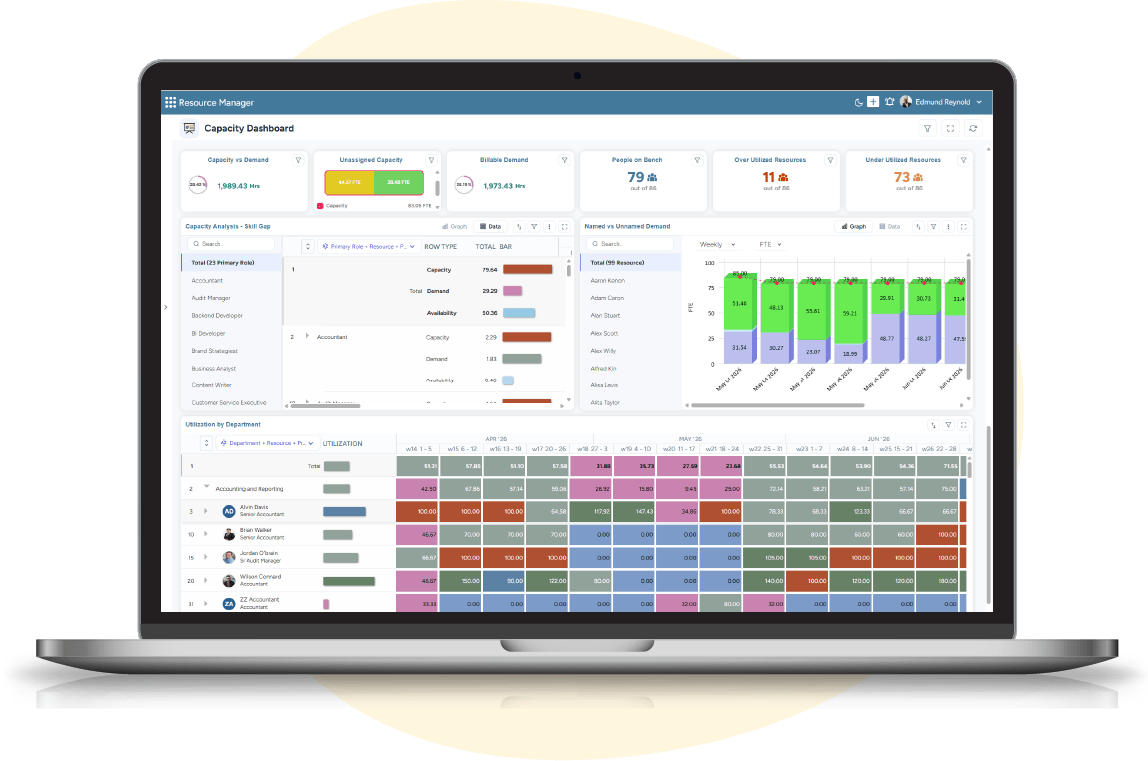
Stronger Where It Matters
- Revenue forecasting linked to resource capacity
- Utilization-driven financial visibility
- Forward-looking margin control
- Scenario-based revenue planning
- Portfolio-level revenue intelligence
- Billing readiness visibility
- Enterprise-grade configurability
- Multi-project and multi-region scalability

Built for Complex Professional Services Revenue Planning
Best suited for organizations needing:
- Multi-project revenue forecasting
- Forward-looking utilization visibility
- Capacity-aware financial planning
- Margin and profitability control
- Billing readiness tracking
- Portfolio-level revenue insight
- Scalable governance across regions and teams


Book Your Interactive Demo
See how intuitive and effective our Resource Management Solution is by booking a customized free demo.
Outcomes Leaders Care About
Improve Revenue Predictability
Forecast revenue earlier and reduce financial surprises.
Protect Project Margins
Identify margin risk before it affects profitability.
Increase Billable Revenue
Align available capacity with revenue-generating work.
Accelerate Cash Flow
Improve visibility into billing readiness and revenue timing.
Reduce Forecasting Errors
Replace spreadsheet-driven assumptions with connected planning data.
Strengthen Executive Control
Give finance, delivery, and leadership teams one revenue outlook.
Why Customers Love Us?


Professional Services Game Changer: Real-Time Workforce Planning & Optimization
Our Insightful eBooks


Frequently Asked Questions
What is revenue forecasting software?
Who should use revenue forecasting software?
How does revenue forecasting software improve revenue predictability?
How can revenue forecasting software help identify revenue risks early?
How does revenue forecasting software help protect project margins?
How does revenue forecasting software improve billing and cash flow visibility?
What features should you look for in professional services revenue forecasting software?
What is scenario-based revenue planning?


Book a 60-Day Free Trial
See how intuitive our solution is by booking a free trial, customized as per your business needs
